

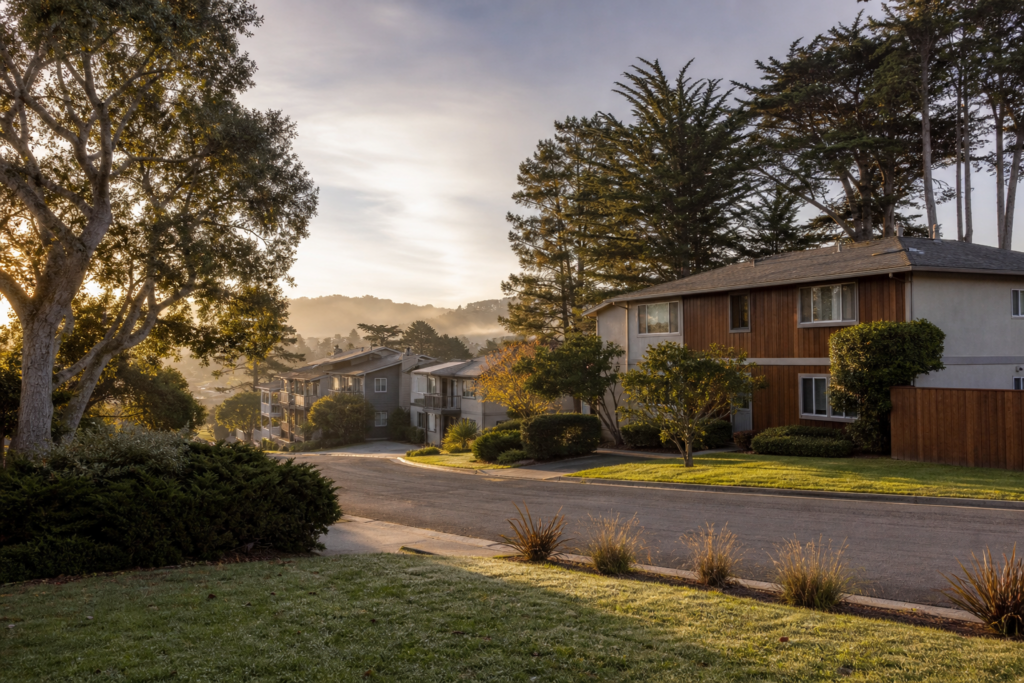
Is Live Oak in Santa Cruz County a good area to buy a rental property in 2026 given the density of renters and current vacancy rates?
Live Oak’s renter-occupied household share of roughly 41%, paired with median rents above $2,400 and home values below the county median, makes it one of the more compelling rental investment options in Santa Cruz County for 2026, though you should model carefully around California’s regulatory environment.
Why Live Oak Matters for Santa Cruz County Rental Investors Right Now
If you have been scanning the central California coast for rental investment opportunities, Live Oak deserves a close look. This unincorporated census-designated place sits immediately east of the City of Santa Cruz, hugging the coastline. With approximately 6,574 total households, according to the 2020 to 2024 American Community Survey (ACS), Live Oak is not sprawling suburbia. Demand for housing remains structurally supported.
What makes it interesting for you as an investor in 2026? The combination of a large renter population, median rents that support positive gross yield potential, and home values that sit below the broader Santa Cruz County median. That trifecta does not come together in every neighborhood, and it is worth understanding why before you commit capital. If you’re looking to understand Santa Cruz County’s neighborhoods more broadly, exploring the best neighborhoods in Santa Cruz can provide helpful context for your investment decision.
Renter Density in Live Oak: What the Numbers Actually Tell You
The single most important number for evaluating rental demand in any neighborhood is the renter-to-owner ratio. In Live Oak, the 2020 to 2024 ACS 5-year estimate from Census QuickFacts placed the owner-occupied housing rate at 58.7%. That means approximately 41% of Live Oak’s roughly 6,574 households are occupied by renters.
Why does that matter to you? A renter share in the low 40s is notable for a coastal California community — particularly given high ownership costs — and signals that a substantial portion of the population either cannot or does not choose to own, creating a structurally deep tenant pool. In practical terms, you are not buying a rental property in a neighborhood where everyone owns their home and your listing sits empty. You are entering a market where renters already make up a significant share of the community.
What Drives Renter Demand in Live Oak
Several structural factors sustain this renter concentration. Live Oak’s proximity to UC Santa Cruz creates a steady flow of students, faculty, and staff who need housing but are not in the market to buy at price points above $1 million. Service workers, young professionals, and dual-income households priced out of ownership in Santa Cruz County also fill this rental pool. With 2.46 persons per household in Live Oak, per Census QuickFacts (2020 to 2024 ACS), you are looking at a community of relatively small households, a meaningful share of which are renters in a high-cost market.
So when you evaluate Live Oak, do not just look at the percentage. Think about what is behind it: a structurally supported demand base tied to persistent local employment and education anchors.
Vacancy Rates in Live Oak: What You Can and Cannot Know in 2026
Here is where you need to be honest with yourself about the data. No current, authority-sourced rental vacancy rate for Live Oak CDP or the surrounding ZIP code was available from Census, HUD, or FRED as of late 2026. The most granular public figures come from the 2020 to 2024 ACS estimates, which do not break out a precise vacancy rate for this small geography at the level of timeliness you would want for a purchase decision.
What does that mean for your analysis? It means you should not rely on a single vacancy number to make your decision. Instead, consider the indicators that surround vacancy:
- High renter density (roughly 41%) suggests sustained demand for rental units
- Median gross rent of $2,421 per month in the 2020 to 2024 ACS (per Census QuickFacts) reflects a market where tenants are paying meaningful rent — though without a current vacancy figure, this alone cannot confirm supply balance
- Constrained housing supply across Santa Cruz County, with only 396 active single-family listings countywide as of September 2026 (per MLSListings data), points to a market where inventory remains limited
None of these replace a hard vacancy number, but taken together, they point toward sustained rental demand, though without a current vacancy figure they cannot confirm how quickly units are filling. If you want a property-specific vacancy estimate before purchasing, I recommend consulting a local property management company familiar with Live Oak’s rental stock.
The Rent-to-Price Relationship in Live Oak: Does the Math Work?
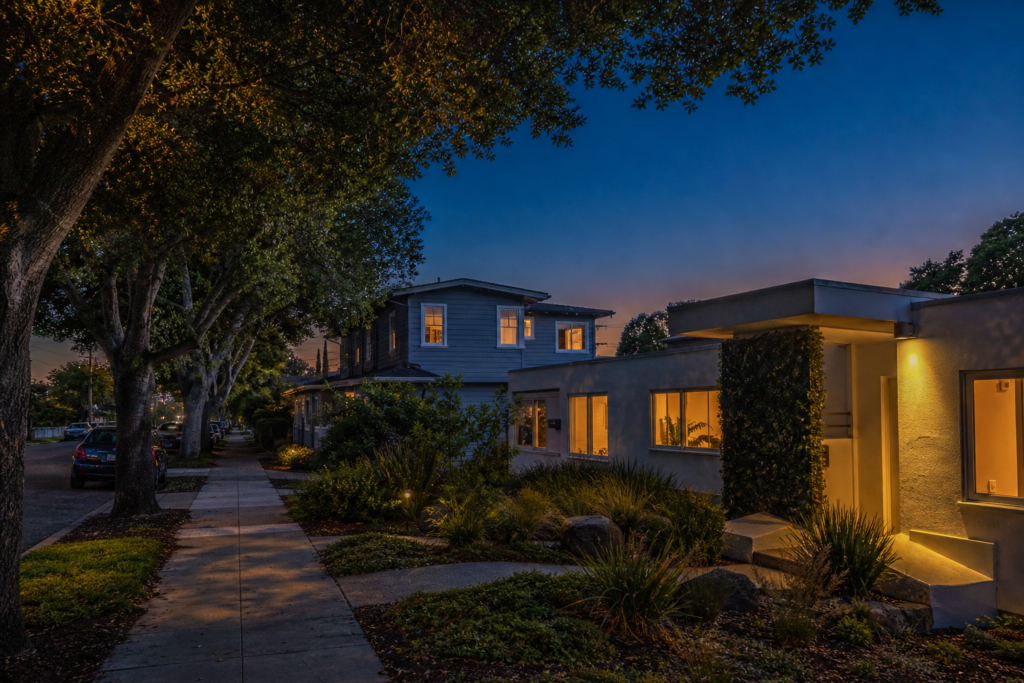
This is where most investors either get excited or walk away, so let us break it down clearly.
Live Oak’s Entry Point Advantage in Santa Cruz County
The 2020 to 2024 ACS median value of owner-occupied homes in Live Oak CDP was $1,015,200, per Census QuickFacts. Compare that to the Santa Cruz County single-family median sale price of $1,250,000 as of September 2026, per MLSListings data. Live Oak’s median home value sits below the county-wide median, giving you a potential entry-point advantage if you are targeting single-family rentals.
If attached housing is on your radar, the county median for condos and townhomes was $697,000 as of September 2026 (per MLSListings), which may further lower your barrier to entry in the broader market.
Gross Yield Potential
Using the ACS figures as a rough illustration: a property purchased near the $1,015,200 median value generating $2,421 per month in gross rent would produce a gross annual rental income of approximately $29,052. That works out to a gross yield of roughly 2.9%. In coastal California markets, some investors factor potential long-term appreciation into their total return modeling, that gross yield paired with long-term equity growth can be attractive. But you need to be realistic: this is not a cash-flow market in the traditional sense. Your returns here are likely to come from a combination of modest positive cash flow (after financing, taxes, insurance, and maintenance), rent growth over time, and property appreciation.
What I tell my clients is that Santa Cruz County rental investing is a long-horizon play. If you are looking for 8% cap rates, you will not find them here. If you are looking for a durable asset in a supply-constrained coastal market with strong renter demand, Live Oak checks important boxes.
Santa Cruz County Market Conditions That Affect Your Live Oak Investment
You are not buying in a vacuum. The broader county market directly impacts your investment thesis in Live Oak.
Inventory and Pricing as of September 2026
- Single-family median sale price: $1,250,000 (per MLSListings, September 2026)
- Condo and townhome median sale price: $697,000 (per MLSListings, September 2026)
- Months of inventory, single-family: 3.8 months (per MLSListings, September 2026)
- Months of inventory, condos and townhomes: 4.2 months (per MLSListings, September 2026)
- Median days on market, single-family: 26 days (per MLSListings, September 2026)
- Sale-to-list ratio, single-family: 99% (per MLSListings, September 2026)
What do these numbers mean for you? A 99% sale-to-list ratio and 26-day median time on market are the figures for this period. At 3.8 months of single-family inventory, you are in balanced territory, not a panic-buying seller’s market. That is actually a healthy sign for investors: you have enough time to negotiate without getting into bidding wars on every property, but the market remains liquid enough that you could sell if your plans change.
Exit Strategy Confidence
One thing I always recommend investors consider is their exit. At 3.8 months, you have reasonable liquidity on both sides. That flexibility matters, especially if you are committing capital to a coastal property at these price points. For sellers looking to understand their market position, knowing exit liquidity is essential to your strategy.
California Regulations You Must Factor Into Your Live Oak Investment
If you are investing in Live Oak, you need to understand the regulatory landscape. California’s landlord-tenant framework is more complex than many other states, and getting it wrong can be costly.
AB 1482 and Rent Caps
California’s Tenant Protection Act (AB 1482) generally caps annual rent increases at 5% plus local CPI, or 10%, whichever is lower, for covered properties. It also requires just-cause eviction protections. Not every property falls under AB 1482; exemptions may apply depending on the property type, age, and ownership structure. You should consult a qualified attorney to determine whether a specific Live Oak property is covered.
Live Oak’s Unincorporated Status: A Key Distinction
Here is a detail many investors miss. The City of Santa Cruz has its own rent control ordinance that applies to certain pre-1995 units within city limits. Live Oak, however, is an unincorporated area of Santa Cruz County. It falls under county jurisdiction, not the city’s rent control rules. This distinction can meaningfully affect your cash-flow projections and regulatory obligations. Before purchasing, verify the current county ordinance status through the Santa Cruz County website and work with a real estate attorney familiar with local regulations.
This is not legal or tax advice, and you should always consult a licensed professional before making decisions based on regulatory assumptions.
Frequently Asked Questions
What percentage of Live Oak households are renters?
Approximately 41% of Live Oak’s roughly 6,574 households are renter-occupied, based on the 2020 to 2024 ACS 5-year estimate from Census QuickFacts. That figure implies the owner-occupied rate is 58.7%. This renter share — roughly 41% of households — suggests a structurally deep tenant pool for investors considering Live Oak rental properties.
What is the median rent in Live Oak, Santa Cruz County?
The 2020 to 2024 ACS median gross rent for Live Oak CDP was $2,421 per month, per Census QuickFacts. You should verify current rental rates through local property management professionals before modeling cash flow.
What is the median home value in Live Oak compared to Santa Cruz County?
Live Oak’s 2020 to 2024 ACS median owner-occupied home value was $1,015,200, per Census QuickFacts. The Santa Cruz County single-family median sale price was $1,250,000 as of September 2026, per MLSListings. Live Oak’s median sits below the county figure, potentially offering a relative entry point for investors.
Is there a current vacancy rate available for Live Oak?
No authority-sourced current vacancy rate for Live Oak CDP was available from Census, HUD, or FRED as of late 2026. You should evaluate demand indicators such as renter density, median rents, and countywide inventory levels rather than relying on a single vacancy figure. A local property manager can provide ground-level vacancy estimates.
Does Live Oak fall under Santa Cruz city rent control?
No. Live Oak is an unincorporated census-designated place within Santa Cruz County. It falls under county jurisdiction, not the City of Santa Cruz’s rent control ordinance. California’s AB 1482 (Tenant Protection Act) may still apply to covered properties, so consult an attorney to confirm your obligations.
How long do homes stay on the market in Santa Cruz County?
The median days on market for single-family homes in Santa Cruz County was 26 days as of September 2026, per MLSListings. suggesting a reasonably active market where well-priced properties have been moving quickly as of September 2026.
What is the sale-to-list ratio in Santa Cruz County?
The single-family sale-to-list ratio was 99% as of September 2026, per MLSListings. This tells you that homes are generally selling very close to their asking prices — whether from accurate initial pricing, negotiation, or both — indicating conditions that are more measured than markets where buyers routinely bid well above asking price.
Is Live Oak better for single-family or condo rental investment?
Both options have merit. Single-family homes in Santa Cruz County carried a median sale price of $1,250,000, while condos and townhomes sat at $697,000 as of September 2026 (per MLSListings). Condos offer a lower capital requirement, while single-family rentals in Live Oak may suit different tenant profiles. Your choice depends on your budget and investment goals.
What drives renter demand in Live Oak?
Live Oak’s proximity to UC Santa Cruz and the City of Santa Cruz employment center creates a persistent pool of renters, including students, faculty, service workers, and young professionals priced out of ownership. High homeownership costs above $1 million reinforce this structural demand.
How many months of inventory does Santa Cruz County currently have?
Santa Cruz County had 3.8 months of single-family inventory and 4.2 months of condo and townhome inventory as of September 2026, per MLSListings. These levels indicate a balanced market, providing reasonable liquidity for investors who may need to adjust their exit timeline.
The Bottom Line
Live Oak offers a combination of attributes that many rental investors look for: a renter-occupied share of roughly 41%, median rents above $2,400 (based on the most recent ACS data), home values below the county median, and a location in a supply-constrained coastal market with structural demand drivers. The absence of a current, precise vacancy rate is a data gap you should address with local professionals, but the surrounding indicators point toward sustained rental demand rather than softness.
You should model your numbers conservatively, factor in California’s regulatory requirements under AB 1482, and confirm whether county-level (not city-level) rules apply to your target property. This is a long-term hold market, not a quick cash-flow play.
If you are evaluating Santa Cruz County investment properties and want to understand how Live Oak fits your specific portfolio goals, reach out to Mario Desantis, Founder of Desantis Realty Group and REALTOR® with Coldwell Banker Realty (DRE #02119587). With specialization in investment properties across Santa Cruz County, you can call (831) 291-0511 or visit desantisrealty.com to start the conversation.
*Mario Desantis, REALTOR®, Coldwell Banker Realty, CA DRE #02119587. Equal Housing Opportunity. This content is an opinion of value and market conditions, not an appraisal. Consult licensed legal, tax, and lending professionals before making investment decisions.*
